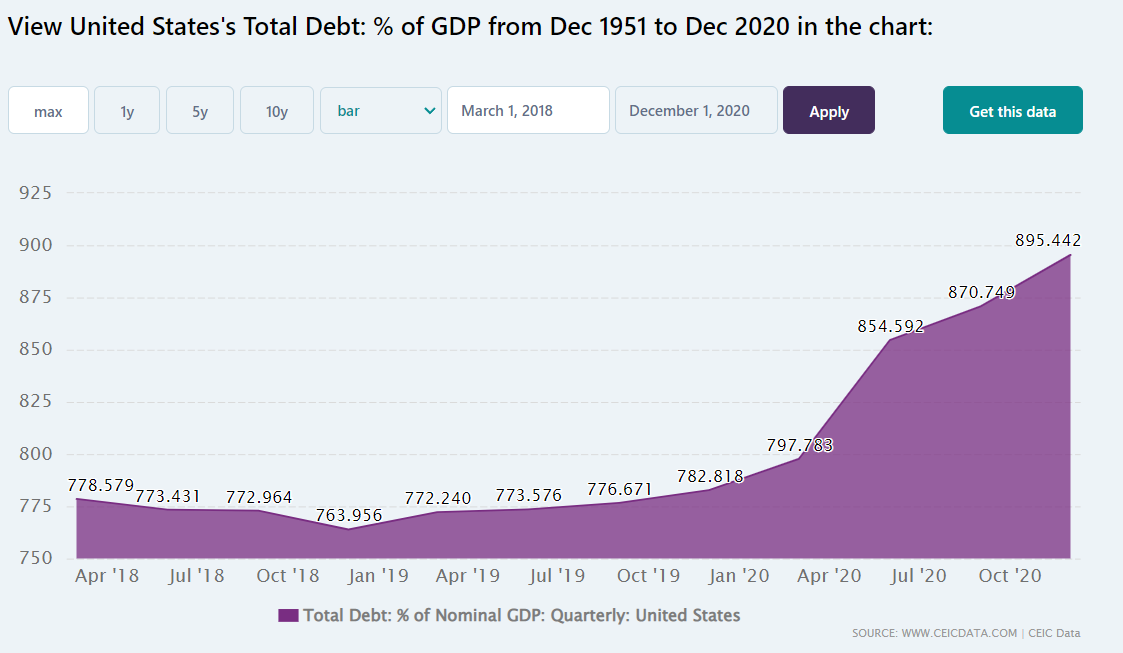
While plenty of sources show total govt debt to GDP ratio, for most countries in the world, there are few sources which tally ALL debt: personal, corporate, and government (private and public). According to CEIC Data, this includes “. Total Debt is calculated as sum of Liabilities for NonFinancial Business, Federal Government, State and Local Government, Households & Nonprofit Organizations and Financial Business less Mutual Fund Shares. Federal Reserve Board provides Total Debt in local currency. Bureau of Economic Analysis provides Nominal GDP in local currency.” Here, we see the following: The total debt as a percentage of GDP. Yes, that shows we are nearing 10x; that is that debt is about to reach 10 times the total GDP, probably large in part due to the slowdown in business during the coronavirus. Time will tell if we recover.
Breaking this Figure Down to the Household Level
The national median family income for the United States for FY 2021 was $79,900, so let’s round to $80,000 for simplicity.
So, if we multiply $80,000 by 900%, you get $720,000 per household. At a 1% interest rate, that is $7,200 in annual interest (does not include principle). In other words, about 10% of our income is going towards interest, but unlike a credit card with 20% interest rate, escaping this type of interest is difficult and fairly un-escapable.
Increase the interest rate to 5% and that turns into $36,000 in interest costs, or $3000/mo., which would represent half the average family income in America today.
So, we really are stuck in a debt trap and zero percent interest. The most likely outcome is that inflation finally kicks in and wipes out much of the debt. Just be sure that if you ever plan to retire and have some savings that you holding low-risk, inflation resistant, tax protected assets (whatever those are I do not know) if you ever hope to retire someday.
On a per capita basis, assuming an average of 2.6 persons per home, that means the average person owes $276,000 in total govt, corporate, and personal debt.
In my case, this means my family owes well over a million dollars.
Including Unfunded Liabilities
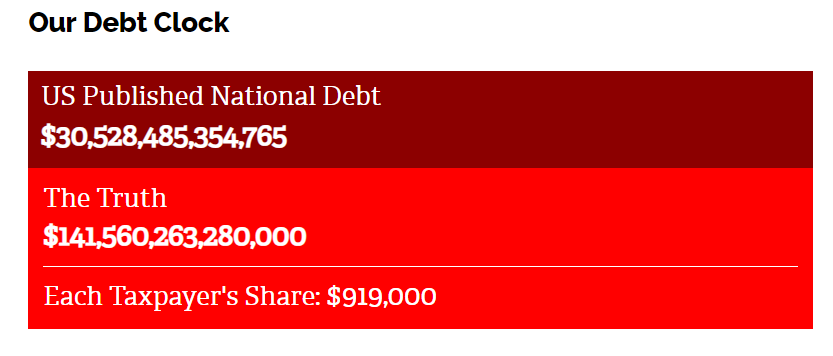
Now this does not include unfunded future liabilities like social security and Medicare. To include those would increase this figure significantly:
Now, I will be the first to say that future liabilities is not a very accurate picture for two reasons: First, they may get changed at some point, and second because the credit contract has not been executed in theory. Second, if we are counting future expenses, we should also count future liabilities. But with that said, let’s look at it anways:
Former chairman of the SEC Chris Cox and former chairman of the House Ways & Means Committee Bill Archer (2012) report roughly $87 trillion in unfunded liabilities using data from the Medicare and Social Security Trustees’ Reports. Their measures
account for the unfunded liabilities—including Social Security, Medicare, federal workers’ pensions—in addition to the official debt.Boston University economist Laurence Kotlikoff calculates a “fiscal gap” amount of $222 trillion using the Congressional Budget Office’s alternative long-term budget forecast. The fiscal gap measure takes into consideration the present value of all the expenditures now through the end of time (including expenditures now through the end of time (including servicing the official debt) and subtracts all the projected taxes from that amount.
George Washington University
Let’s just round it to $200 trillion. Now the average person can expect to owe upwards of $600,000 dollars, and the average family / household around $3,000,000. My family technically will owe $5,000,000. Again, I expect some wild inflation at some point, but then, that may not solve the problem because while economists are good at pencil math, they are often poor at people math. In the meantime, I will just keep growing my homestead.